- Education
- About Forex
- Forex Chart Patterns PDF
Forex Chart Patterns PDF

Features
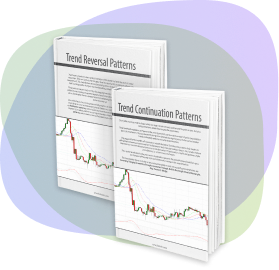
The Main Forex Chart Patterns PDF below covers the basic functions of trend continuation and trend reversal patterns. They will help you understand the purpose and the formation mechanism of chart patterns. Moreover, you will be introduced to the way of price levels evaluation which is a primary step in trading. Do not lose your chance to learn the key features of trading chart patterns and make your trade easy and convenient. If Forex Chart Patterns is a bit hard to understand we suggest start from basics - What is Forex.
- What do the forex chart patterns stand for?
- How much are they helpful for you?
- What are the basics you should know?
- How to use them?
- How to implement the best method to calculate the price targets?
Continuation Chart Patterns
Trend continuation patterns are formed during the pause in the current market trends and mainly mark the movement continuation.These patterns indicate that the price action displayed is a pause in the prevailing trend.
They help traders to differentiate pause in the price movement from its complete reversal and show that upon breaking out of the pattern the price trend will continue in the same direction.
Reversal Chart Patterns
Trend reversal patterns are essential indicators of the trend ending and the start of a new movement. They are formed after the price level has reached its maximum value in the current trend. The main feature of trend reversal patterns is that they provide information both on the possible change in the trend and the probable value of price movement.
