- Analytics
- Market Data
- Indices Prices
- S&P 500 Live Chart
S&P 500 Chart and Live Prices Today
This page includes full information about the S&P 500 Index, including the S&P 500 Index live chart and dynamics on the chart by choosing any of 8 available time frames.
By moving the start and end of the timeframe in the bottom panel you can see both the current and the historical price movements of the instrument. In addition, you have an opportunity to choose the type of display of the S&P 500 Index live chart – Candles or Lines chart – through the buttons in the upper left corner of the chart. All clients that have not yet decided which instrument to trade are in the right place since reading the full characteristics of the SP500 and watching its performance on the charts will help them to make their final decision.
S&P 500 Live Chart
- 1m
- 5m
- 15m
- 30m
- 1h
- 4h
- 1d
- 1w
This page includes full information about the S&P 500 Index, including the S&P 500 Index live chart and dynamics on the chart by choosing any of 8 available time frames.
By moving the start and end of the timeframe in the bottom panel you can see both the current and the historical price movements of the instrument. In addition, you have an opportunity to choose the type of display of the S&P 500 Index live chart – Candles or Lines chart – through the buttons in the upper left corner of the chart. All clients that have not yet decided which instrument to trade are in the right place since reading the full characteristics of the SP500 and watching its performance on the charts will help them to make their final decision.
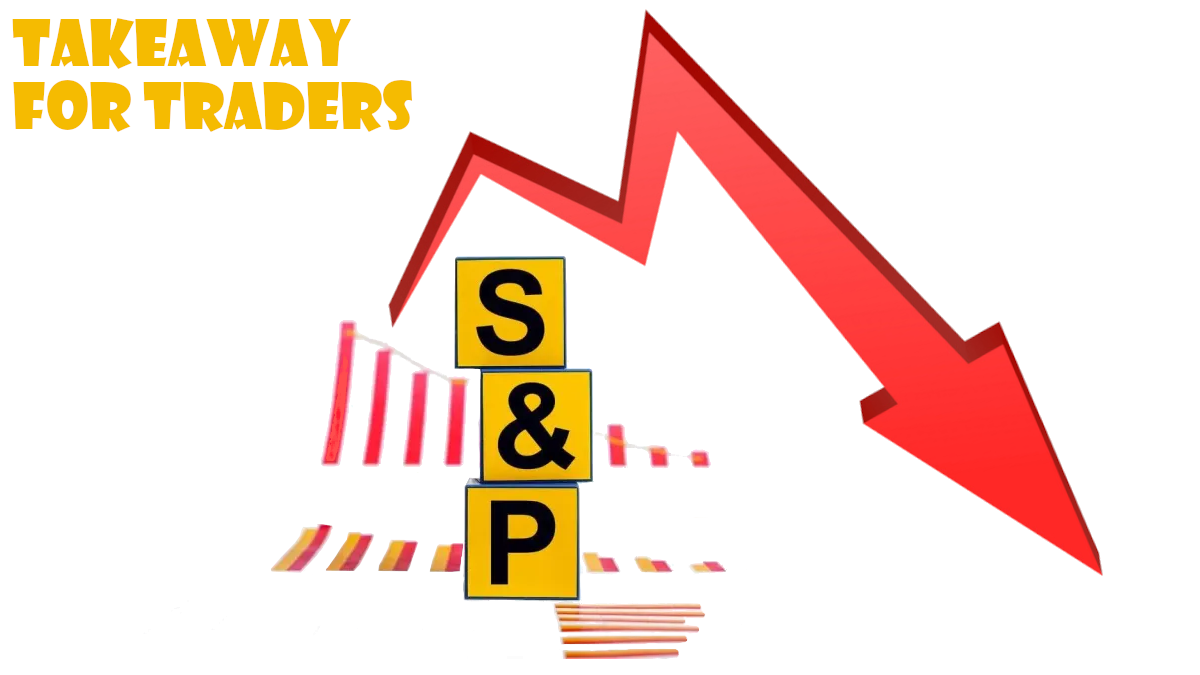
S&P 500 Index Technical Analysis
On SP500 technical analysis of the price chart in 4-hour timeframe reveals the SP500,H4 is retreating under the 200-period moving average MA(200) after rebounding to one-week high two days ago. We believe the bearish momentum will continue after the price breaches below the lower boundary of Donchian channel at 5304.37. A level below this can be used as an entry point for placing a pending order to sell. The stop loss can be placed above 5447.83. After placing the order, the stop loss is to be moved every day to the next fractal high, following Parabolic signals. Thus, we are changing the expected profit/loss ratio to the breakeven point. If the price meets the stop loss level (5447.83) without reaching the order (5304.37), we recommend cancelling the order: the market has undergone internal changes which were not taken into account
Fundamental Analysis of Indices - S&P 500 Index
US economic reports were mixed yesterday. Will the SP500 decline continue?
Recent US economic data were mixed. The decline in New York State manufacturing activity slowed while US import prices decreased. According to the Empire State Manufacturing Survey, the Empire State Manufacturing Index rose to -8.1 in April from -20.0 in March when an increase to -12.8 was expected. Readings above 0.0 indicate improving conditions, below 0.0 indicate worsening conditions. The Federal Reserve Bank of New York reported that the business activity declined modestly after steep decline in previous month, while “price increases picked up to the fastest pace in more than two years. Firms turned pessimistic about the outlook for the first time since 2022.” At the same time, the Bureau of Labor Statistics reported US import prices unexpectedly fell while export prices remained unchained. Import prices slipped 0.1% over month in March on lower fuel costs following a downwardly revised 0.2% increase in February when no change was expected. In annual terms, import prices increase slowed to 0.9% over year in March from a 1.6% rise in February. Slower than expected decline in New York State manufacturing activity is bullish for SP500, while declining import prices is bearish for the SP500 index. The current setup is bearish for the SP500.
| Indicator | Signal |
| RSI | Neutral |
| MACD | Sell |
| Donchian Channel | Sell |
| MA(200) | Sell |
| Fractals | Sell |
| Parabolic SAR | Buy |
S&P 500 News
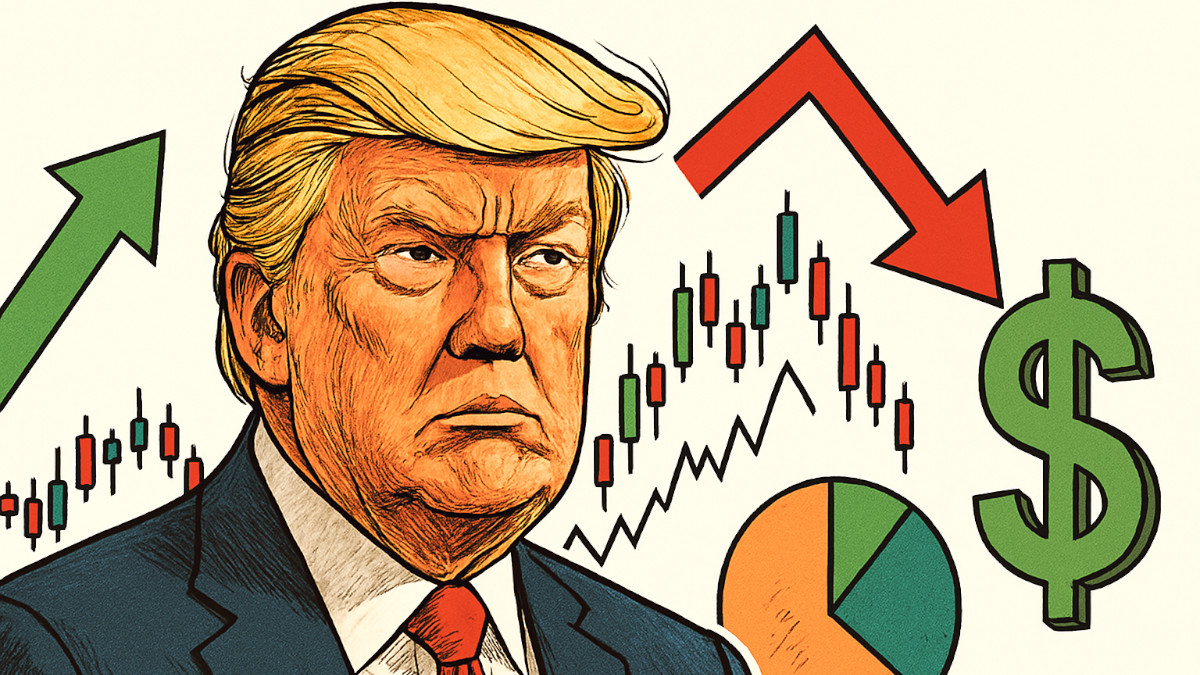
Markets Rally After Trump Pauses Tariffs
Markets jumped. But not because things got better—just because they got less worse. In classic fashion, Donald Trump reversed...
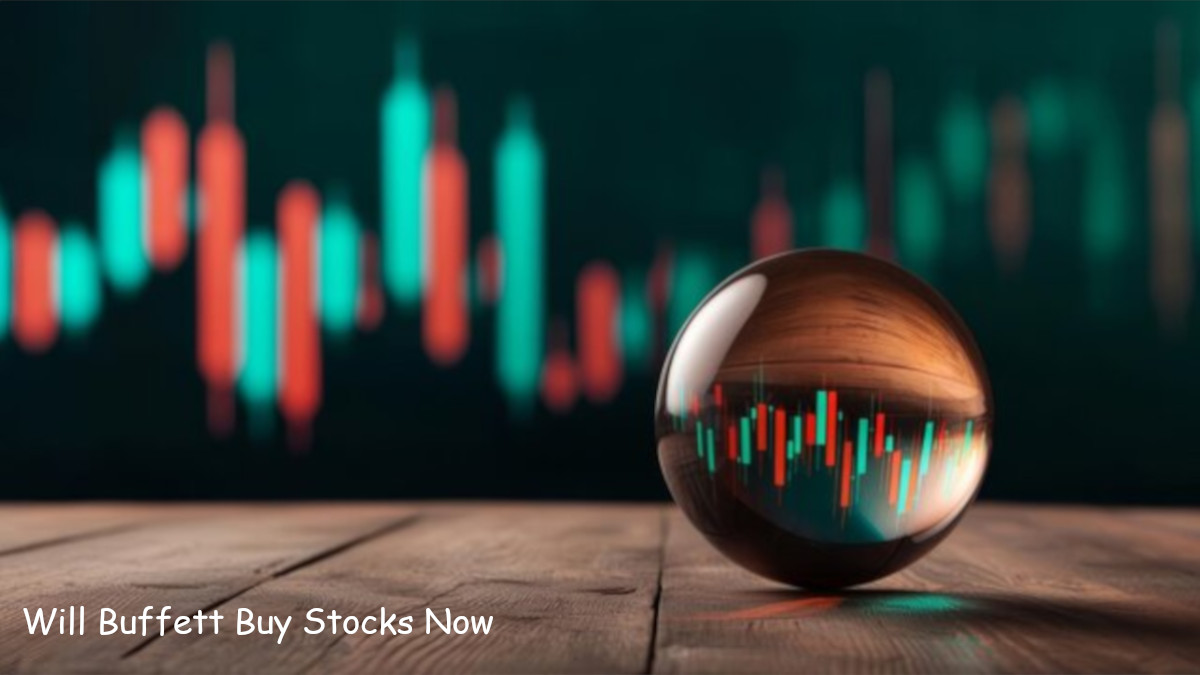
What Buffett’s Strategy Means for the SP 500
The recent stock market drop has made Berkshire Hathaway a popular choice for investors looking for stability. With a huge...
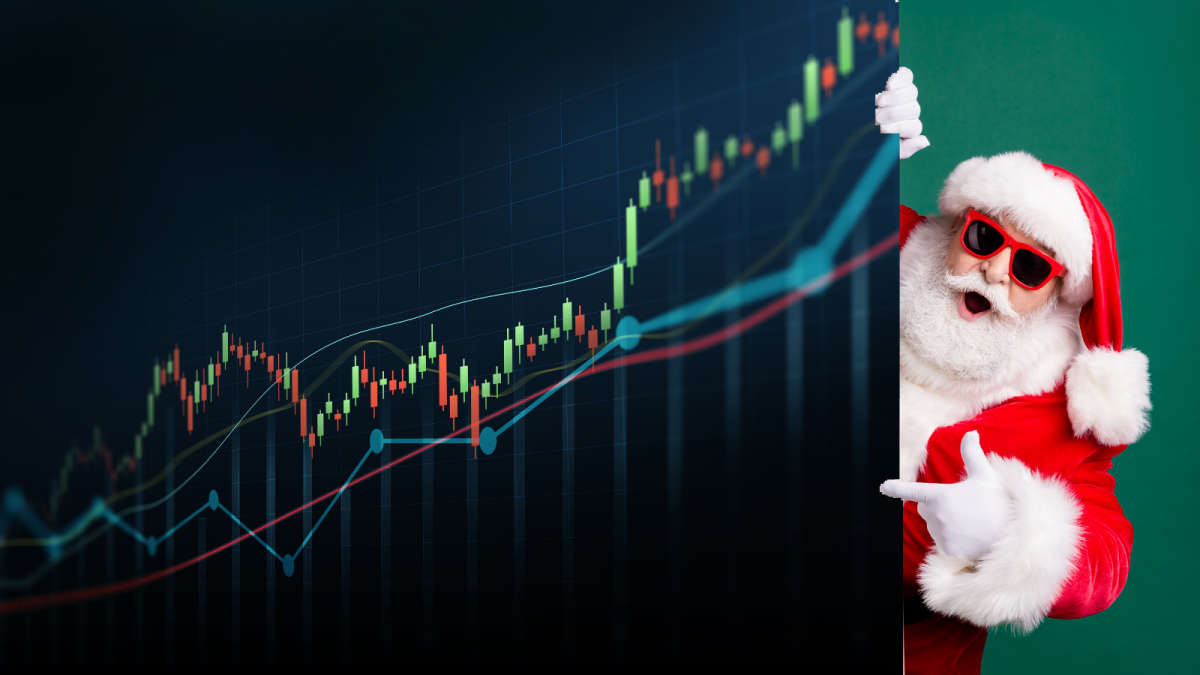
The Santa Claus Rally
The Santa Claus rally is one of those quirky trends that pop up in the stock market. It’s when stock prices tend to climb...
SP500 News and Price Analysis
The S&P 500's decline in July and August of 2024 is a complex issue with multiple contributing factors. Here are some of...

Market Analysis: SP 500 Price Forecast
The US stock market closed slightly higher on Monday, with the S&P 500 and Nasdaq reaching new record closing highs. However,...
SP 500 Index News Analysis Today
The stock market is experiencing a downturn, with the SP 500 falling for four consecutive sessions in April. This decline...