- Education
- Forex Technical Analysis
- Technical Indicators
- Trend Indicators
- Exponential Moving Average
Exponential Moving Average: Formula, Settings and How to Use it
Exponential Moving Average (EMA) indicator stands as a widely used and versatile tool. Traders rely on the EMA indicator to assess trend direction, identify potential entry and exit points, and smoothen price data for improved analysis. With its ability to adapt more quickly to recent price movements compared to other moving average types, the EMA indicator has gained significant popularity among traders.
In this article, we are going to cover everything about the Exponential Moving Average (EMA) indicator; exploring its definition, calculation methodology, interpretation, and practical applications.

Key points to be covered in the article:
- Understanding the Exponential Moving Average (EMA):
- Calculation of the EMA:
- Interpreting the EMA Indicator:
- Practical Applications of the EMA Indicator:
- Combining the EMA Indicator with Other Tools:
By unraveling the intricacies of the Exponential Moving Average (EMA) indicator, traders gain a valuable tool for trend identification, entry and exit timing, and overall market analysis.
So let’s get started
What is Exponential Moving Average
The Exponential Moving Average (EMA) is a widely used technical indicator in financial markets. It is a type of moving average that gives more weight to recent price data, making it more responsive to price changes compared to other moving average types.
The EMA calculates the average price of an asset over a specified period, giving more significance to the most recent data points. It is called "exponential" because it applies an exponentially decreasing weight to older price data as it moves further back in time.
The formula used to calculate the EMA involves two main components: the previous EMA value and the current price. The previous EMA value serves as a starting point, and then the current price is used to adjust the EMA calculation based on a smoothing factor or multiplier.
The EMA is typically represented as a line on a price chart, which visually represents the average price movement over time. Traders use the EMA to identify trends, determine potential entry and exit points, and gauge the overall direction of the market.
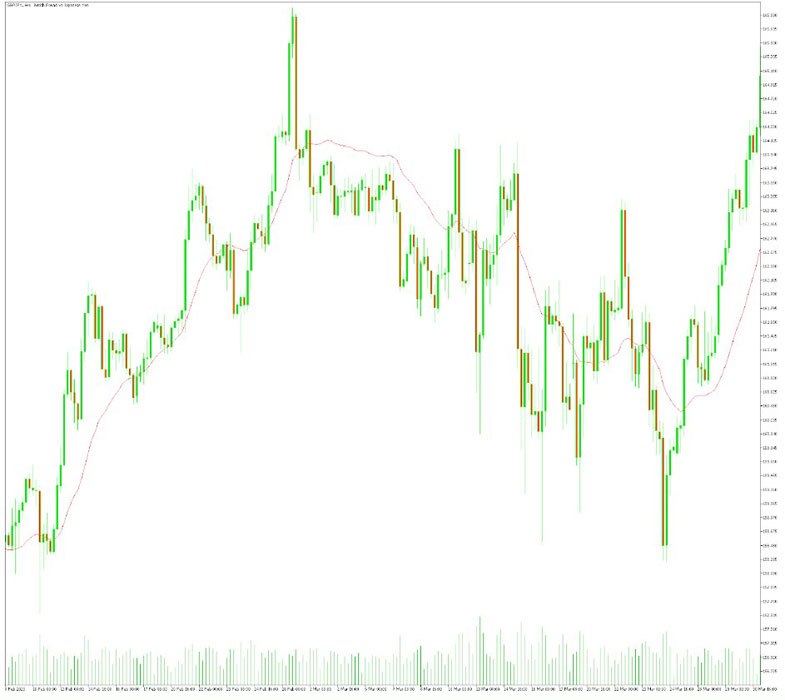
The EMA is adaptable and provides more weight to recent price movements, making it particularly useful for short-term trading strategies. It can help traders capture price trends more quickly compared to other moving averages that place equal weight on all data points.
It's important to note that the EMA's responsiveness to recent price data also means it can be more prone to false signals during periods of high volatility or choppy market conditions. Therefore, traders often combine the EMA with other technical indicators and analysis techniques to gain a more comprehensive view of the market.
Overall, the Exponential Moving Average (EMA) is a powerful tool that helps traders analyze price trends, spot potential trading opportunities, and make informed decisions. By incorporating the EMA into their technical analysis toolbox, traders can enhance their understanding of market dynamics and improve their trading strategies.
How to Use EMA Indicator
The Exponential Moving Average (EMA) indicator can be a valuable tool in technical analysis. Here are some key steps to effectively use the EMA indicator:
- Identify the Trend
- Select the EMA Period
- Observe EMA Crossovers
- Confirm with Price Action
- Consider EMA Slope
- Use EMA as Support/Resistance
- Combine with Other Indicators
Identify the Trend
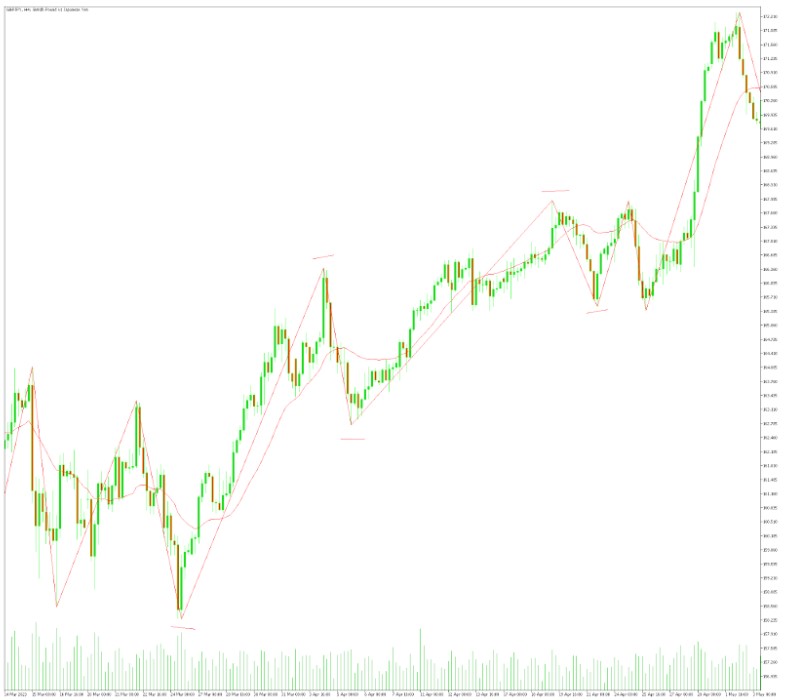
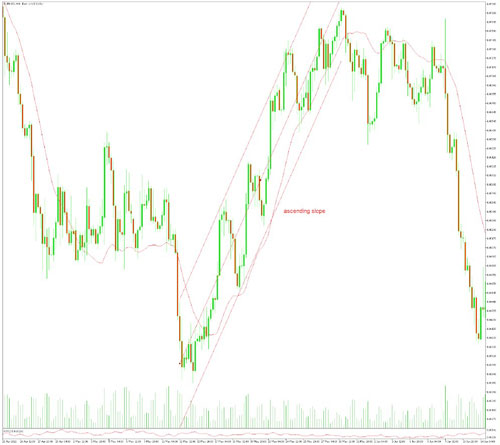
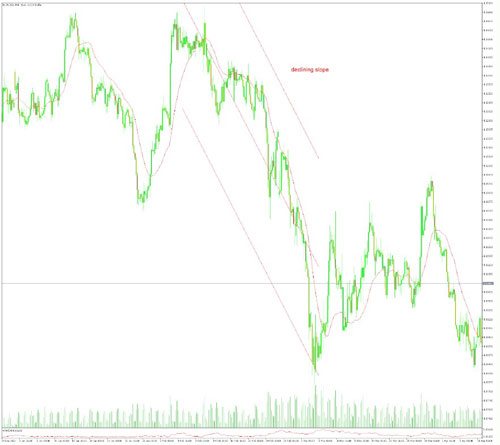
The EMA can help you determine the direction of the trend. When the EMA line is sloping upward, it indicates an uptrend, while a downward sloping EMA line suggests a downtrend. This can help you align your trades with the prevailing market direction.
Select the EMA Period
Determine the period or time frame that suits your trading strategy. Shorter periods, such as 9 or 20, are commonly used for short-term trading, while longer periods, like 50 or 200, are more suitable for longer-term analysis. Experiment with different periods to find what works best for your specific trading style and timeframe.
Observe EMA Crossovers
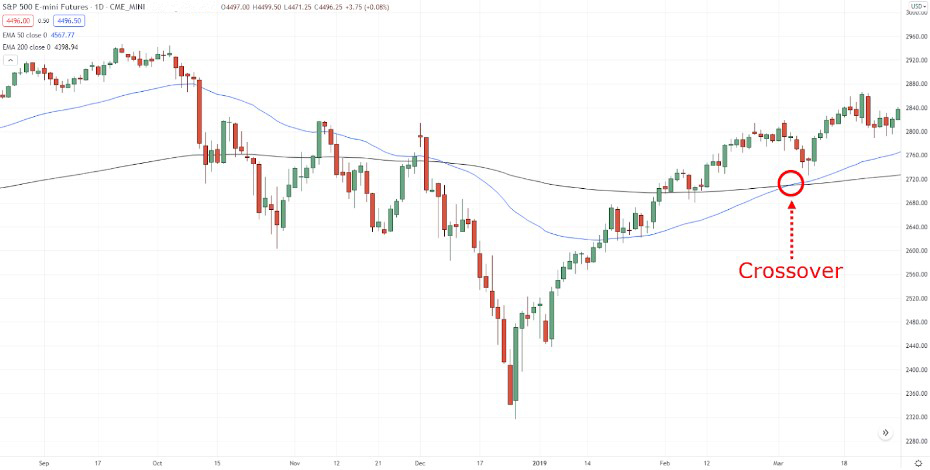
EMA crossovers occur when two EMAs of different periods intersect. The shorter-term EMA crossing above the longer-term EMA is a bullish signal, suggesting a potential buying opportunity. Conversely, the shorter-term EMA crossing below the longer-term EMA is a bearish signal, indicating a potential selling opportunity. These crossovers can help you identify potential entry or exit points.
Confirm with Price Action
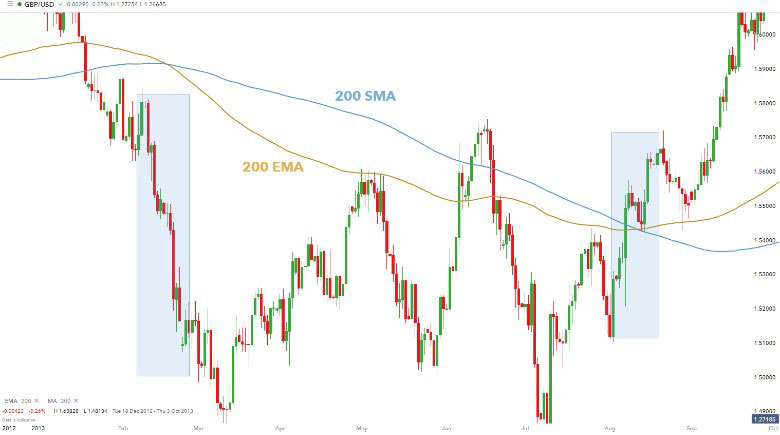
Combine EMA analysis with price action to validate signals. Look for instances where the price is also confirming the EMA signal. For example, during an uptrend, you might consider entering a long trade when the price retraces to the EMA and shows signs of support.
Consider EMA Slope
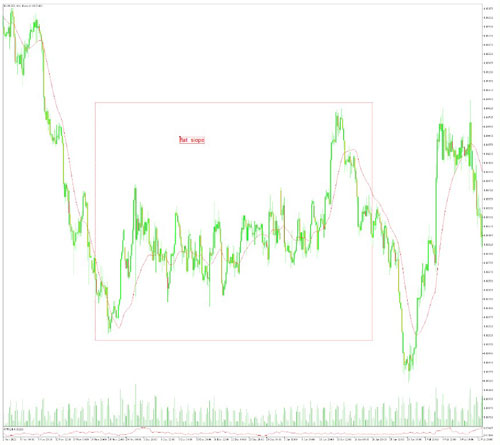
Besides crossovers, the slope of the EMA can provide valuable information. A steep upward slope suggests a strong trend, while a flat or declining slope indicates a weakening trend or consolidation. You can use the slope to gauge trend strength and adjust your trading decisions accordingly.
Use EMA as Support/Resistance
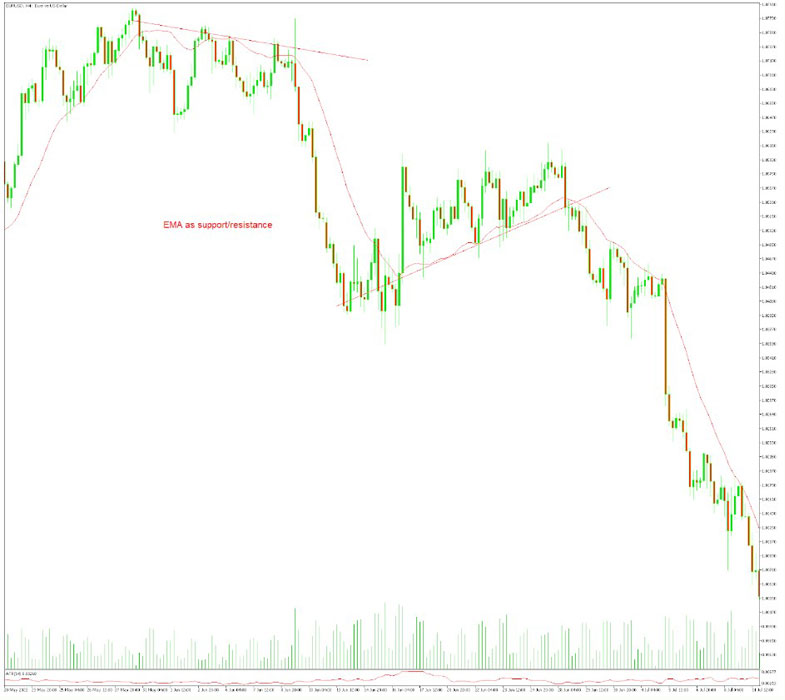
The EMA can act as dynamic support or resistance levels. If the price bounces off the EMA and continues in the direction of the trend, it reinforces the strength of the trend. Conversely, if the price breaks below or above the EMA, it may indicate a potential trend reversal.
Combine with Other Indicators
To enhance your analysis, consider using the EMA in conjunction with other technical indicators. For example, you can use the EMA in combination with oscillators like the Relative Strength Index (RSI) or the Moving Average Convergence Divergence (MACD) for additional confirmation.
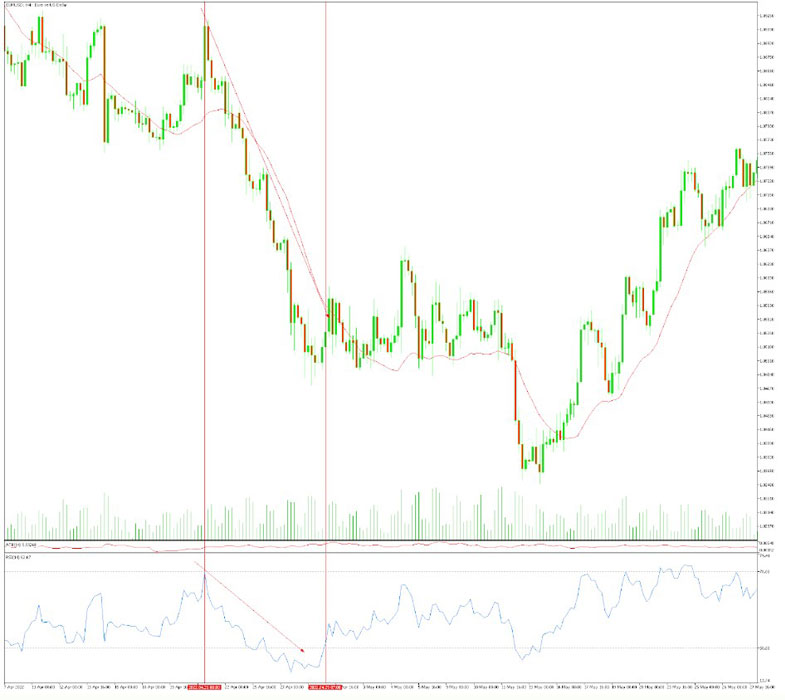
Exponential Moving Average Formula
EMA = Closing price x multiplier + EMA (previous day) x (1-multiplier)
Where:
Closing price is the closing price of the security on the current day.
Multiplier is a weighting factor that determines how much weight is given to the most recent price. The multiplier is calculated as 2 / (number of periods + 1).
EMA (previous day) is the EMA value from the previous day.
EMA Indicator Calculation
The formula to calculate the Exponential Moving Average (EMA) involves several steps:
- Select the period or time frame (N) for which you want to calculate the EMA.
- Calculate the Simple Moving Average (SMA) for the first period (N) using the closing prices of the asset. This represents the initial EMA value.
- Determine the smoothing factor or multiplier (α) based on the selected period. The smoothing factor is calculated as follows: α = 2 / (N + 1).
- For the subsequent periods, use the following formula to calculate the EMA:
EMA = (Current Price - Previous EMA) * α + Previous EMA
- Current Price: The closing price of the current period.
- Previous EMA: The EMA value calculated for the previous period.
- α: The smoothing factor or multiplier.
Repeat this calculation for each period, using the most recent EMA value to calculate the next EMA.
By applying this formula iteratively, the EMA adjusts and places more weight on recent price data, making it more responsive to changes compared to other moving averages. The result is a line that smooths out price fluctuations and provides a trend-following indicator.
It's important to note that when calculating the EMA for the initial period (N), the SMA is used as the starting point. After that, the EMA is calculated based on the previous EMA value and the current price.
Remember to adjust the period and smoothing factor based on your trading strategy and time frame preferences. Additionally, many charting platforms and trading software provide built-in EMA indicators that perform the calculations automatically, so manual calculations may not always be necessary.
EMA Indicator Settings
When using the Exponential Moving Average (EMA) indicator, there are several settings that you can adjust to suit your trading strategy and time frame. Here are the key settings to consider:
Period
The period refers to the number of data points used in the EMA calculation. It determines the time frame over which the EMA is calculated. Shorter periods, such as 9 or 20, are commonly used for short-term trading, while longer periods, such as 50 or 200, are more suitable for longer-term analysis. Adjusting the period allows you to capture different degrees of price movement and adapt the EMA to your preferred trading style.
Smoothing Factor
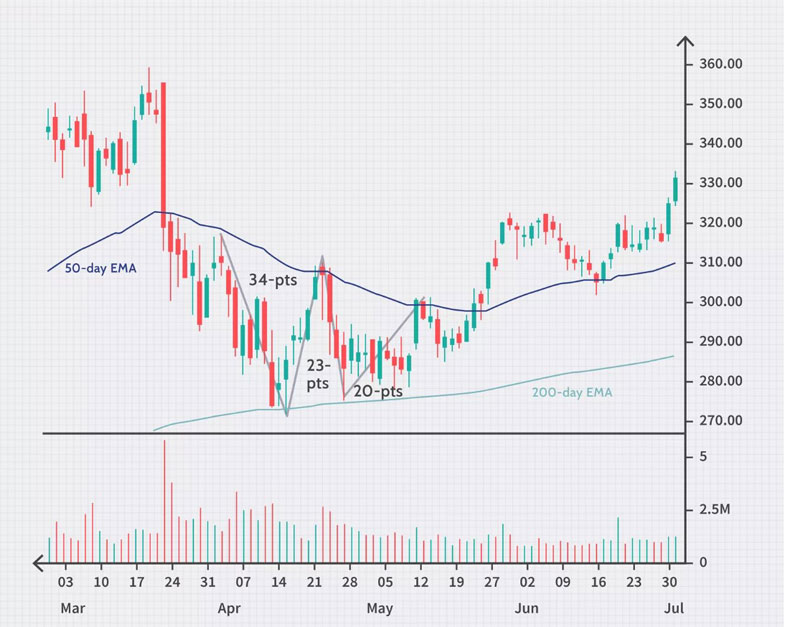
The smoothing factor, also known as the multiplier, determines the weight assigned to recent price data. It is calculated as: α = 2 / (N + 1), where N represents the selected period. The smoothing factor controls how quickly the EMA responds to price changes. A smaller smoothing factor places more emphasis on recent prices, making the EMA more responsive. Conversely, a larger smoothing factor places more weight on past prices, resulting in a slower-moving EMA. Experimenting with different smoothing factors can help you fine-tune the EMA's responsiveness to suit your preferences.
Price Type
The EMA can be calculated using different price points, such as the closing price, high price, low price, or an average of the high and low prices. The most commonly used price point is the closing price, as it reflects the final market sentiment for a given period. However, you can choose the price type that best aligns with your trading strategy and preferences.
Adjusting these settings allows you to customize the EMA indicator based on your specific trading needs. Shorter periods and smaller smoothing factors make the EMA more sensitive to recent price changes, suitable for active traders and short-term analysis. On the other hand, longer periods and larger smoothing factors make the EMA smoother and better suited for capturing longer-term trends.
Optimal settings for the EMA may vary depending on the market being analyzed and the specific trading strategy employed. It's recommended to experiment with different settings and assess their effectiveness within your trading approach before incorporating the EMA into your decision-making process. Additionally, many charting platforms and trading software provide pre-configured EMA indicators with adjustable settings, simplifying the process of applying the indicator to your charts.
Bottom line on Exponential Moving Average
In summary, the Exponential Moving Average (EMA) is a powerful technical indicator that helps traders analyze trends, identify potential entry and exit points, and smoothen price data for improved analysis. Here are the key takeaways on the EMA:
- Trend Identification: The EMA can be used to determine the direction of the trend. An upward sloping EMA suggests an uptrend, while a downward sloping EMA indicates a downtrend. It helps traders align their trades with the prevailing market direction.
- Responsiveness to Price Changes: The EMA is more responsive to recent price data compared to other moving average types. It assigns greater weight to recent prices, making it particularly useful for short-term analysis and capturing immediate price movements.
- EMA Crossovers: Traders often look for EMA crossovers as potential entry and exit signals. When the shorter-term EMA crosses above the longer-term EMA, it generates a bullish signal, while a crossover in the opposite direction produces a bearish signal. These crossovers can help identify potential trend reversals or confirm the strength of an existing trend.
- Confirmation with Price Action: Combining the EMA analysis with price action can provide additional confirmation for trading signals. Observing how the price interacts with the EMA, such as bouncing off it or breaking through it, can help validate the signals generated by the EMA.
- Support and Resistance Levels: The EMA can act as dynamic support or resistance levels. Price bounces off the EMA can indicate potential areas of support or resistance, reinforcing the strength of the trend or suggesting potential reversals when broken.
- Customization for Trading Style: Traders can adjust the EMA settings, such as the period and smoothing factor, to align with their preferred trading style and time frame. Shorter periods and smaller smoothing factors make the EMA more sensitive to recent price changes, while longer periods and larger smoothing factors provide smoother trends.
Remember, consider testing different settings and combinations of indicators to find the optimal approach for your trading strategy. Practice using the EMA indicator on historical data and continuously refine your approach to enhance your trading decisions.
Forex Indicators FAQ
What is a Forex Indicator?
Forex technical analysis indicators are regularly used by traders to predict price movements in the Foreign Exchange market and thus increase the likelihood of making money in the Forex market. Forex indicators actually take into account the price and volume of a particular trading instrument for further market forecasting.
What are the Best Technical Indicators?
Technical analysis, which is often included in various trading strategies, cannot be considered separately from technical indicators. Some indicators are rarely used, while others are almost irreplaceable for many traders. We highlighted 5 the most popular technical analysis indicators: Moving average (MA), Exponential moving average (EMA), Stochastic oscillator, Bollinger bands, Moving average convergence divergence (MACD).
How to Use Technical Indicators?
Trading strategies usually require multiple technical analysis indicators to increase forecast accuracy. Lagging technical indicators show past trends, while leading indicators predict upcoming moves. When selecting trading indicators, also consider different types of charting tools, such as volume, momentum, volatility and trend indicators.
Do Indicators Work in Forex?
There are 2 types of indicators: lagging and leading. Lagging indicators base on past movements and market reversals, and are more effective when markets are trending strongly. Leading indicators try to predict the price moves and reversals in the future, they are used commonly in range trading, and since they produce many false signals, they are not suitable for trend trading.

