- 교육
- 외환거래 전략
- Strategies by Forex Analysis
- Technical Analysis Strategy
- Trend Trading Strategy
Forex Trend Trading Strategy
What is Trend Trading
A trend is nothing more than a tendency, a direction of market movement, i.e. one of the most essential concepts in technical analysis. All the technical analysis tools that an analyst uses have a single purpose: help identify the market trend. The meaning of the Forex trend is not so much different from its general meaning - it is nothing more than the direction in which the market moves. But more precisely, foreign exchange market does not move in a straight line, its moves are characterized by a series of zigzags which resemble successive waves with clear peaks and troughs or highs and lows, as they are often called.
Trend trading is considered a classic trading strategy, as it was one of the first of them, and takes its rightful place today. We believe that trend trading will remain relevant among traders around the world in the future. All thanks to three main, but simple principles:
- Buy when the market goes up, i.e. we are seeing an uptrend/bullish trend
- Sell when the market goes down, i.e. we are seeing a downtrend/bearish trend
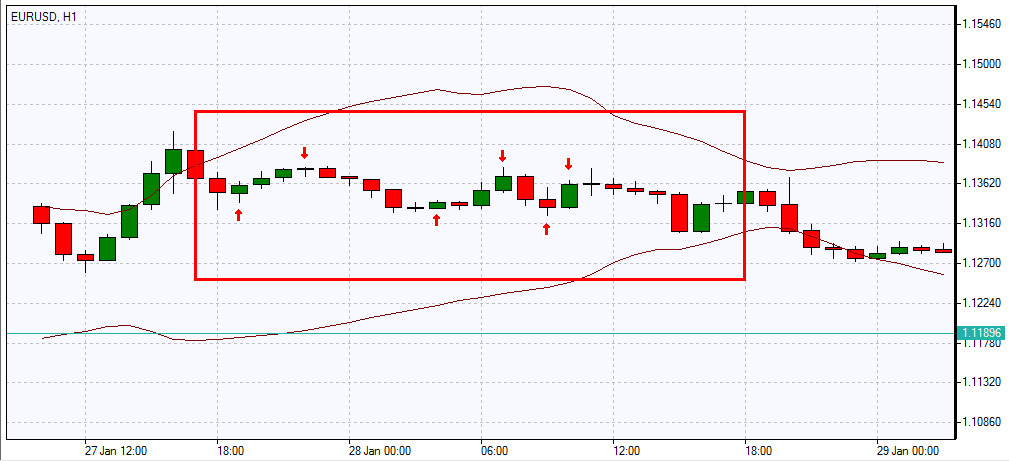
- Wait and take no action when the market moves neither up nor down, but horizontally, i.e. we are seeing a sideways trend/consolidation

Sideways trend
The trend following strategy can be applied to trade on a wide variety of timeframes, but the most accurate forecasts and lower risks relate to medium and long-term trading, where stronger and long-lasting trends are observed. Trend trading can be the best choice for swing traders, position traders, i.e. those who see and predict the direction of the market movement in the future. However, both scalpers and day traders also catch trends, but less strong and very short-lived, a sort of fluctuations within the main trend.
Any trader, regardless of their trading method, must first of all use technical analysis to determine the current trend in the market of a traded asset and try to predict its further development, using technical analysis. The technical analysis tools applied are usually extremely simple and user-friendly, each trader can select a variety of indicators, lines, time frames, etc., based on the characteristics of the asset they invest in, their individual preferences and other factors. However, the most commonly used ones are moving averages of different periods, Bollinger bands, the Alligator indicator, Ichimoku cloud, Keltner channels, MACD and ADX indicators, as well as various advanced modifications of classic indicators. Since the indicators are inherently lagging, i.e. reflect the impact of past events and market movements, it is also important to use oscillators to predict the development of the trend and identify the entry points, set stop loss, take profit, trailing stop orders correctly.
Here are three main techniques for entering the market:
- Classic (i.e., entering the market at the intersection of two moving averages)
- At a breakout (i.e., placing a pending order and entering the market after confirming the price intention to continue the trend)
- At a retreat (i.e., entering the market not immediately by a trading signal, but later, when the price is at a more favorable level)
Breakout and classic techniques have some similarities, for example, in both cases the absence of a take profit order and the setting of a trailing stop would be a rational decision. Entering the market at a retreat is riskier, since there is no guarantee the trend will continue as intended rather than reverse.
But back to the types of trends in Forex. According to the theory of supply and demand, the market has 4 main phases of development:
- Accumulation (sideways movement, consolidation).
- Markup (bullish trend/uptrend).
- Distribution (sideways movement, consolidation).
- Markdown (bearish trend/downtrend).
In fact, on a two-dimensional chart, the trend can move up (phase №2), down (phase №4), or remain relatively horizontal (phases №1 and №3). Let's go through each of the types of trends in Forex separately.
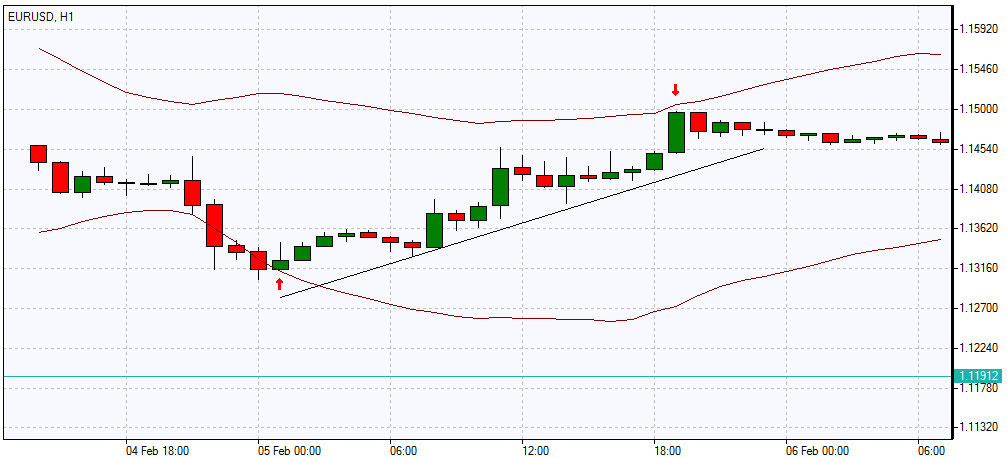
An uptrend, or bullish trend, is a movement in the price of an asset when the lows and highs progressively increase, i.e. every next maximum/minimum is higher than the previous maximum/minimum. In fact, the bullish trend identifies a growth in price on a specific timeframe. As a rule, traders begin to actively buy exactly on the ascent of the trend line, but often they open positions when the bullish bias reaches its peak and flows into the phase of distribution, in which the price moves horizontally and prepares for the final phase of the bullish trend.

Bullish trend
However, non-professional traders hold their positions longer than necessary at the end of an uptrend, hoping for the trend to continue, and often move into drawdown and lose their investments. More experienced traders manage to correctly detect the end of the 1st market phase, i.e. just before the price advances, and open long positions. Short positions are opened either during the distribution phase or at the very beginning of the 4th phase when the trend reverses. The current bullish trend can be detected by drawing the support line at the low points: the price bounces up at the lows, as if pushing off the support line, thereby increasing the highs. If the support line vector on the chart is pointing up, then this is definitely an uptrend.
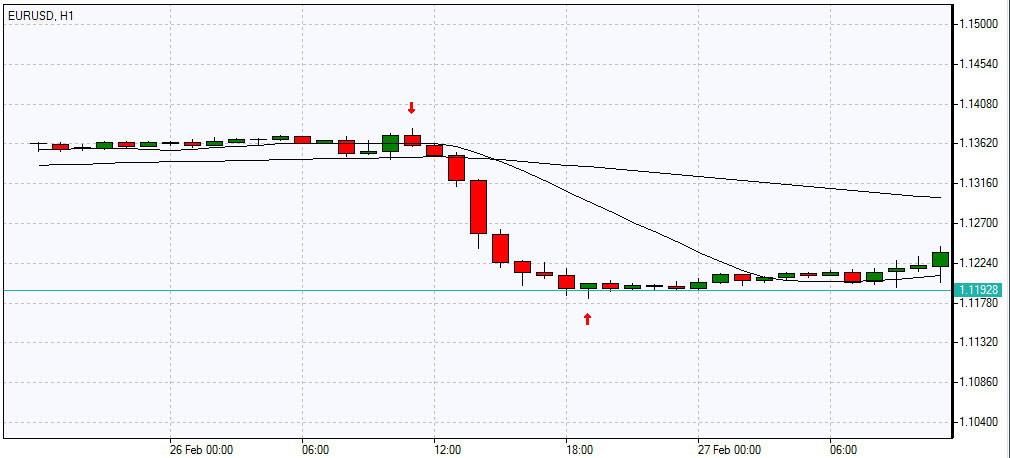
A downtrend, or bearish trend , is a movement in the price of an asset when the lows and highs consistently decrease, every next maximum/minimum is lower than the previous maximum/minimum. In fact, the bearish trend identifies a fall in price on a particular timeframe. The downtrend goes through the same phases and in the same sequence as an uptrend: accumulation of positions, stabilization of the trend, distribution (consolidation).

Bearish trend
However, if traders go long during the uptrend, then the downtrend implies the opening of short positions, and it is important to set sell orders (including pending orders) within the distribution phase at the desired price. In a downtrend, the trend line (in this case, the resistance line) is drawn along the tops: the price, as if meeting resistance, repels and tends downward, then, with a slight correction, rises back to the support line and bounces off. If the resistance line vector on the chart is directed downward, then this is definitely a downtrend.
There is an expression popular among traders: “Trend is your friend” which applies to both the uptrend and the downtrend. However, we can observe an apparent trend only 20-30% of the time, the rest of the time the market is relatively neutral and remains flat, i.e.the price is traded in a narrow range, shifting between resistance and support lines. A sideways trend, or consolidation, occurs when the potential of bears and bulls becomes equal, this often happens before the release of important macroeconomic and other news, since traders do not know exactly how this news will affect the movement of the asset’s price. That is why the sideways trend acts as the first and third market phases when positions are accumulated and distributed. Also, sideways movement occurs due to the lack of players in the market between trading sessions or during trading of any asset at an atypical time for it (for example, when trading a European currency pair before the opening of the European session). Trading in a sideways trend is possible, but extremely risky. Such a movement will work more for scalpers who make money precisely from small and frequent fluctuations within predictable limits.
Let's sup up the above with a few remarks:
- Trend is your friend, definitely. But you shouldn’t trade without taking into account the main principles of money and risk management and in the absence of a well-thought-out strategy.
- The Forex trend trading is inherently simple, but this doesn’t mean it is inefficient. The complexity of trading strategies would only hinder the trader.
- At least 2 timeframes are required to identify the trend more reliably.
- You can visually understand the direction of the trend as follows: the price from the lower left corner rises to the upper right corner - a bullish trend; the price from the upper left corner falls to the lower right corner - a bearish trend; the price moves flat and horizontally - a sideways trend.
- The market moves horizontally about 70% of the time, but trading with such a movement is not worth it unless you have experience and a clear understanding of the market behavior during the accumulation and distribution phases.
- The more often the price meets the resistance/support line and, repelling, keeps the movement vector, the stronger and more stable the trend.
- If the price goes up/down sharply and steeply, the trend is more likely to reverse. If the trend is flatter, evenly rising/falling, then there is a high probability that it will last long.


