Natural Gas News And Price Prediction
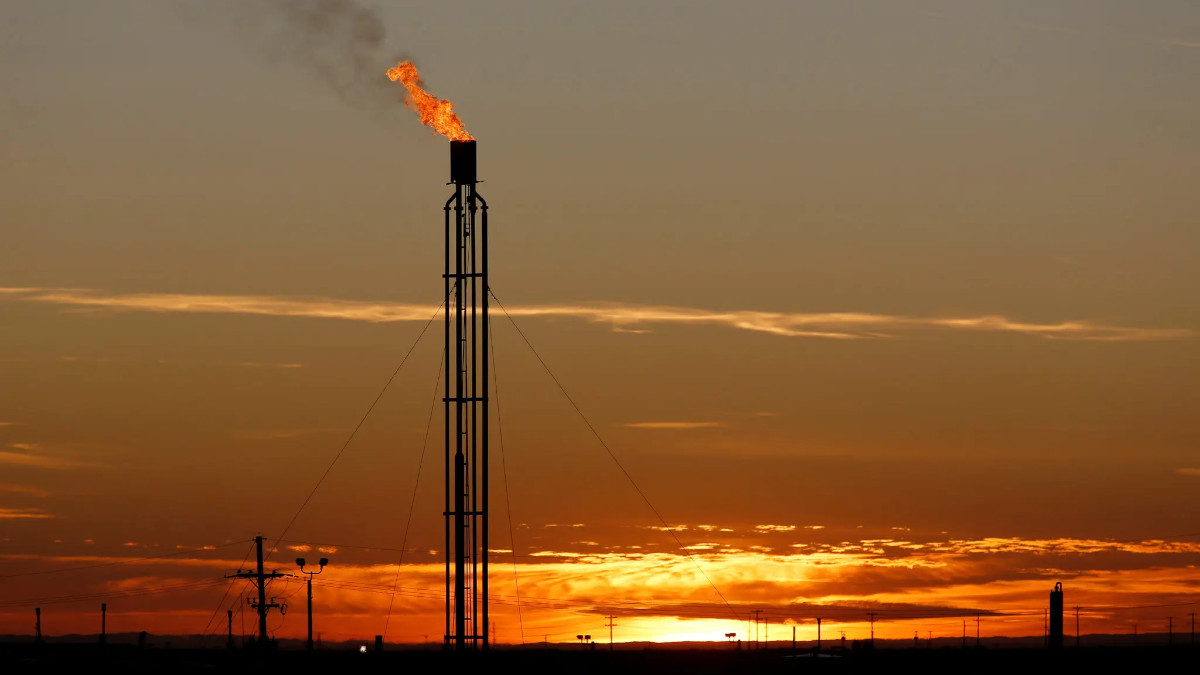
Natural gas futures rose on Monday, driven by a combination of factors.
Unexpected weather forecasts predicting hotter temperatures across most of the country sparked a surge in national demand for natural gas, particularly in Texas and the Eastern regions. This resulted in a significant jump in futures prices at the open of trading.
Supportive production trends over the weekend helped alleviate recent bearish sentiment caused by rising output. Lower production levels contributed to the early gains on Monday.
While exports remain below peak levels due to ongoing maintenance, there have been improvements. Gas flows to export plants have increased, suggesting potential for future price movements.
However, the price of natural gas remains uncertain due to several factors:
- Substantial Supply
U.S. natural gas production has been increasing, and stockpiles are at high levels. This abundance of supply could put downward pressure on prices. - Market Volatility
The natural gas market has been experiencing increased volatility, with daily price movements fluctuating within a 10-20 cent range. This reflects ongoing uncertainty about weather and production. - Short-Lived Rallies
Previous gains due to higher demand forecasts and increased LNG exports have often been short-lived as the market focuses on the oversupply issue.
Market Forecast
While current conditions suggest downward pressure, there's room for a price rally if demand rises consistently and production slows down.
Factors to watch in the coming weeks
- Consistent hot weather will likely increase demand and potentially lead to price hikes.
- Increased exports could tighten supply and put upward pressure on prices.
- A decrease in production, especially if accompanied by rising demand, could trigger a price rally.
Technical Analysis
- Head and Shoulders Pattern: Natural gas is testing a potential resistance level, which could indicate a continuation of the downtrend.
- Fibonacci Extension: If the price falls, it might target support levels around $2.64, $2.50 or even lower.
- Moving Averages: The 100-day average is currently below the 200-day average, traditionally a bearish sign. However, the price is recently moving back up, hinting at a possible reversal.
- Stochastic and RSI Oscillators: Stochastic suggests some room for price increase, but RSI is already indicating a potential decline. This creates some uncertainty about the future direction.
Technical indicators suggest a potential downtrend, but there's also a chance for a reversal. Fundamentals point to both bearish (inventory build) and bullish (seasonal demand) factors. The upcoming US jobs data might influence prices depending on the outcome.


