- Trading Platforms
- Platforms
- User Manuals
- NetTradeX Windows Manual
- Percentage Charts
Percentage Charts
The user has an opportunity to display the dynamics of the change of several (up to 10) financial instruments on one chart. The dynamics of each instrument is calculated in percents of the price change from the set moment over time (common to all instruments of this chart). Thus, all curves of this chart require only one percentage scale.
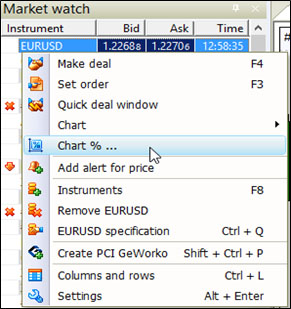
To open the percentage chart, select “Trading” from the main menu and click on “Chart % …” or in any of “Market watch”, “Open positions”, “Sum open positions”, “Orders” windows right-click on the trading instrument or the corresponding position or order. Select “Chart % …” option from the opened context menu.

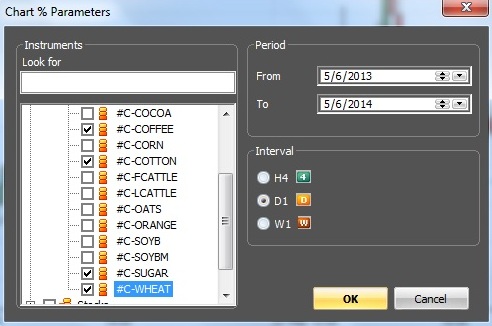
In the opened “Chart % Parameters” window you will be offered to choose the percentage chart parameters.

In this window you can choose the following parameters:
- Financial instruments, the percentage change of which is displayed on the created chart. In “Instruments” list you should tick the selected instruments on the left (if the dialog is called from the window with an active instrument line, that instrument is already ticked)
- Time frame from the list – 4 hours, 1 day, 1 week
- Starting day for calculation
- Final day for calculation.
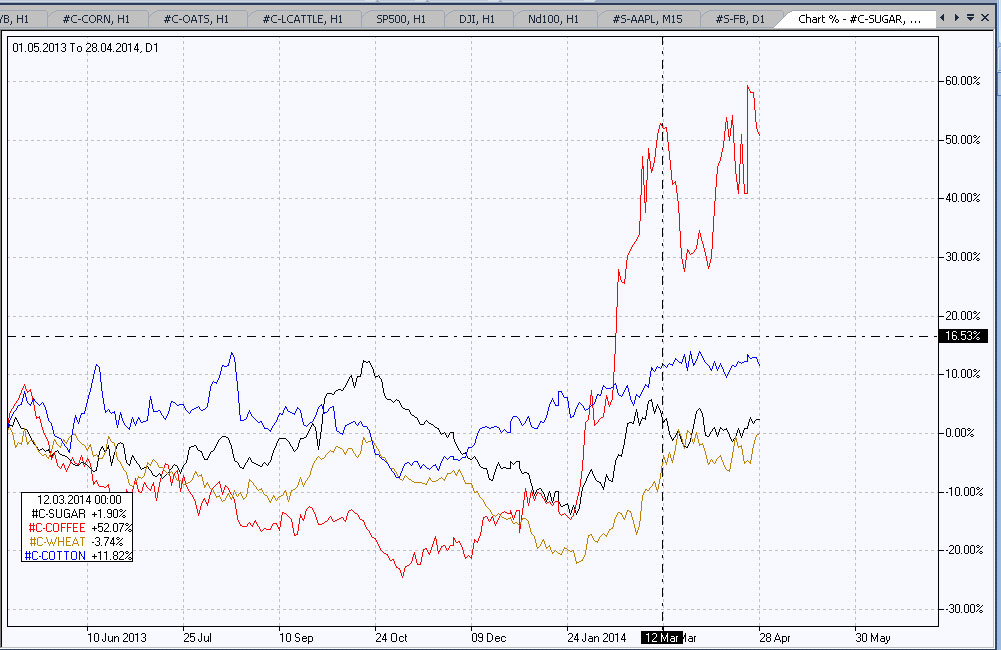
Press “OK” button and the percentage chart will be built. A percentage chart for four Commodity CFDs is selected as an example.

The line of each instrument is calculated at the closing price of the corresponding bar and is displayed with its color. In the lower left corner of the chart a table with the time and the percentage deviation of each instrument at the cursor current location on the chart on the time axis is displayed. In the example the cursor location is visible due to “Crosshair” graphical object.
Note that in this version of the terminal the percentage chart is not built automatically on the time axis beyond the specified final day. To extend the chart, its building should be completed by specifying a new final time through “Parameters” function of the chart context menu.
