- IFC Markets 이노베이션
- PCI 적용 관련 기사
- 포트폴리오 거래
Risk Diversification | Risk Reduction - Portfolio Quoting Method
Modern portfolio theory suggests significant benefits from diversification. Using Portfolio Quoting Method toolset we would like to show how exactly an investor benefits from diversification. For this example we have chosen two well-known securities included in the index Dow Jones Industrial Average.
More precisely we have chosen the stock of McDonald’s (MCD) and Altria Group (KO) and have examined their behavior over the past 4 years. For this purpose closing prices have been used during the past 50 months.
The correlation coefficient calculated for the two stocks on the basis of their incremental returns was 0.53, confirming that portfolio construction could reduce risks. At the same time we have calculated average annual estimates of returns and standard deviations for the two securities. These values are given in the table:
| MCD | KO | |
| Mean annual return | 13.7% | 16.3% |
| Annual Standard Deviation | 14.0% | 15.2% |
Judging from our estimates, it can be concluded that the stock of Altria Group (KO) in the post-crisis period was more risky than McDonald's (MCD) stock. This is reflected in the higher standard deviation of return of Altria Group (KO). However, as a compensation for higher risk, the average annual return of Altria Group (KO) was also higher.
If we assume that our realized risks and returns are good estimates of future risks and returns, and that only one security may be chosen for investment, we face a common problem of choice: accept a higher level of risk, hoping for higher returns, or accept lower returns with less risk. This question often depends on individual preferences of the investor, the investment needs and constraints.
However, portfolio theory confirms that the risks can be reduced through diversification. To confirm this, we are going to create a portfolio of the two stocks with the help of PQM method. Suppose our budget is $ 2,000. At current prices we invest 1000 USD buying shares of McDonald's (MCD) and remaining 1000 USD are used to buy shares of Altria Group (KO). Assuming that the quantity of stocks is a continuous value, we get a portfolio consisting if 10.18 (MCD priced at 98.24 USD) and 24.93 (KO priced at 40.12 USD) stocks of first and second companies, respectively.
As well as the prices of both securities, the portfolio's value has been mainly growing during the last four years: it is obvious from the chart. But to compare the parameters of risk and return of the portfolio with the same parameters of each of the securities, let’s calculate its average annual return and standard deviation. The values are presented in the table below:
| MCD | KO | Portfolio | |
| Mean annual return | 13.7% | 16.3% | 14.7% |
| Annual Standard Deviation | 14.0% | 15.2% | 12.8% |
The annual average realized return of the portfolio was 14.7%, lower than the return of Altria Group (KO), but higher than that of McDonald's (MCD). At the same time we were able to achieve a lower standard deviation. Annual standard deviation of the portfolio was 12.8%, although for both securities separately it is higher.
Reduced risk was due to the fact that the two stocks are not absolutely correlated. Also note that the return of the portfolio is not equal to the average value of returns of the two stocks, as equal weights for shares in the portfolio are guaranteed only for the last observation, at prices used to calculate the number of the first and second stocks in the portfolio of 2000 USD.
Scatter plot of realized risks and returns allows setting two stocks and the portfolio in the same plane for comparing their parameters (y-axis: mean annual return; x-axis: standard deviation):
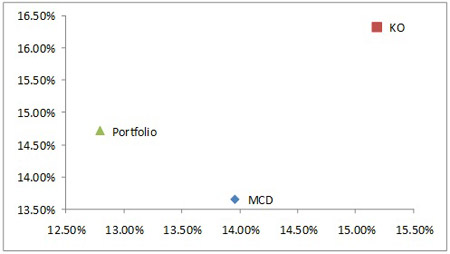
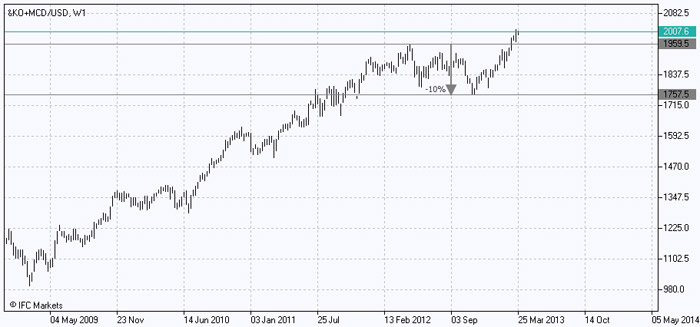
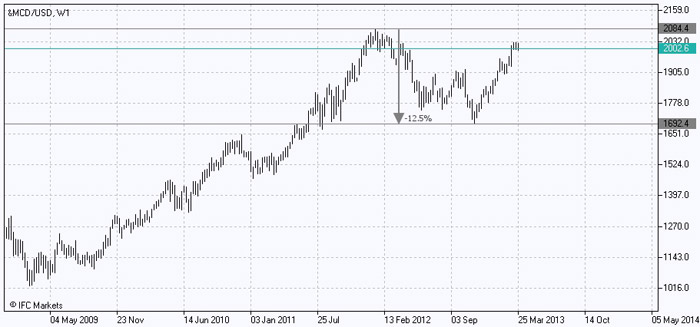
We can say only one thing with certainty: if the calculated values of return and standard deviation are good estimates of future returns and standard deviations - a rational investor would prefer the constructed portfolio to shares of McDonald's (MCD) - the portfolio has a better risk-return profile. The choice between the portfolio and stocks of Altria Group (KO) will depend on individual preferences and constraints. Let’s have a look at $ 2,000-value portfolio and two retrospective charts of $ 2,000 invested today in shares of McDonald's (MCD) and Altria Group (KO) separately:
Portfolio
McDonald’s (MCD)
Altria Group (KO)
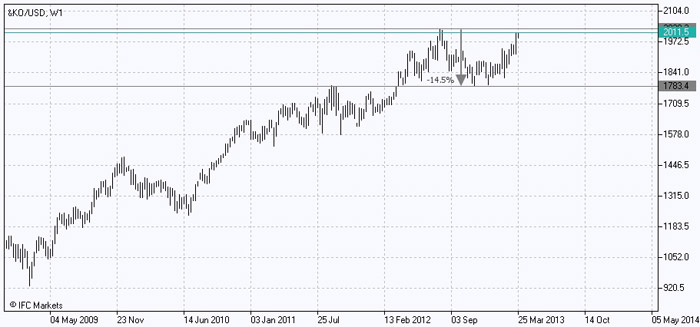
Visually charts also confirm that the growing curve of retrospective value of the portfolio is smoother, reflecting its lower volatility compared to the two stocks.
To add, in the last 4 years the most significant drop in value of Altria Group (KO) stocks, the more volatile securities in our analysis, amounted to about 14.5%. The similar indicator for the stock of McDonald's (MCD) was about 12.5%. At the same time the largest drop in value of the portfolio during the least "favorable" period was only about 10%.
On the example of only two securities, we were convinced that portfolio construction really provides a big advantage in the form of risk reduction. The resulting portfolio was characterized by a lower standard deviation of returns than separately any of assets included in the portfolio. These assumptions are confirmed both by quantitative calculations and chart analysis, obtained using PQM method. If you put charts of the values of the three investment alternatives (the constructed portfolio, investment in shares of Altria Group (KO) and investment in shares of McDonald's (MCD)) together, you will get the following picture:
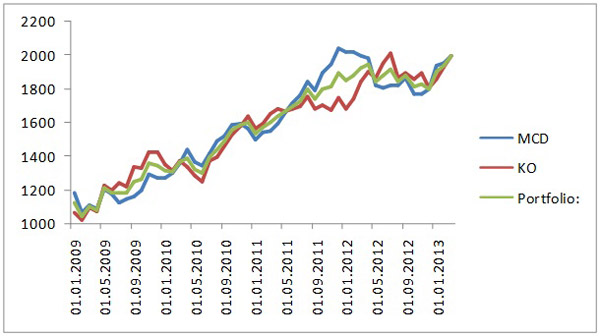
The portfolio dynamics represents an average between the dynamics of investments in each of the securities: more "smooth" curve of the portfolio reflects the benefit from diversification. PQM method allows you to build an infinite number of such portfolios and look for the most appropriate combination of risk and return, which finally will depend on investor's individual needs and constraints.
OLDER_GEVORKO_SECRETS
- Fourth basic tenet of Dow Theory: serving the investor
- Portfolio spread based on continuous futures
- Sharpe Portfolio | "The Three Leaders" - DJIA, S&P500, Nasdaq 100
- Portfolio Quoting Method for Analysis of "Good" and "Bad" Portfolios
- Portfolio Optimization through PQM Method (Part 2)
- Portfolio Optimization through PQM Method (Part 1)
